What are Dashboard Widgets?
Dashboard Widgets are like mini-reports which can be accessed directly from your TempWorks Enterprise Dashboard. They allow you to keep your finger on the pulse of your business. At a glance view data such as your top 25 Customers, number of new Orders, number of recruiting calls, etc... Widgets are also interactive, you can "drill down" into a Widget to go to the specified record(s) or report which has generated the data.
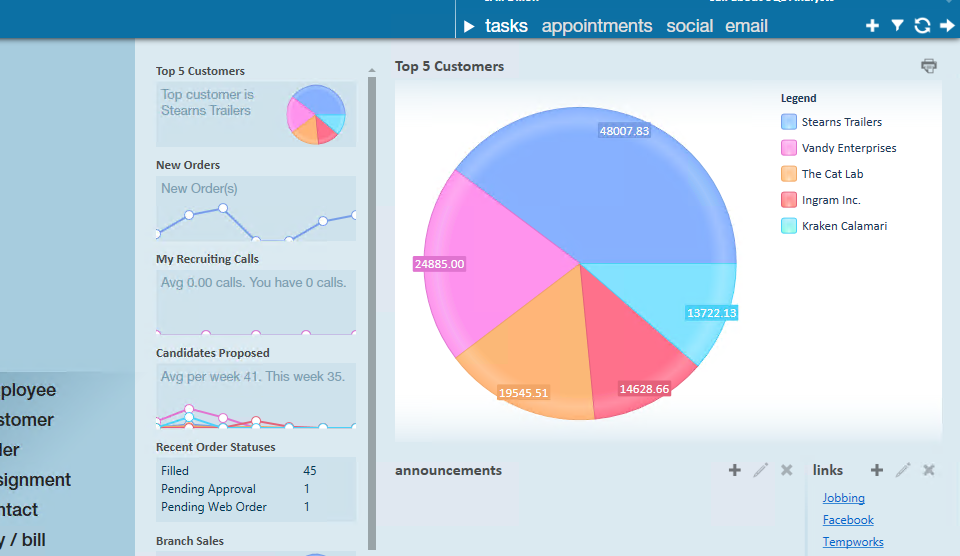
The Dashboard is your home screen in TempWorks Enterprise. Dashboard Widgets are the graphs which appear on your Dashboard.
*Note* Widgets are Security Role and Hierarchy based so you may or may not have the same Widgets/Data as a co-worker.
Dashboard Widget Setup
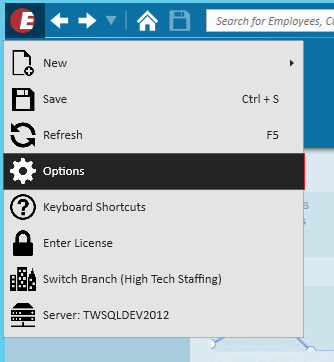
Each user is able to select what widgets they would like to display on their dashboard. To select the Dashboard Widgets you'd like displayed, click the "e" button in the upper left corner of your screen. Select Options then Dashboard.
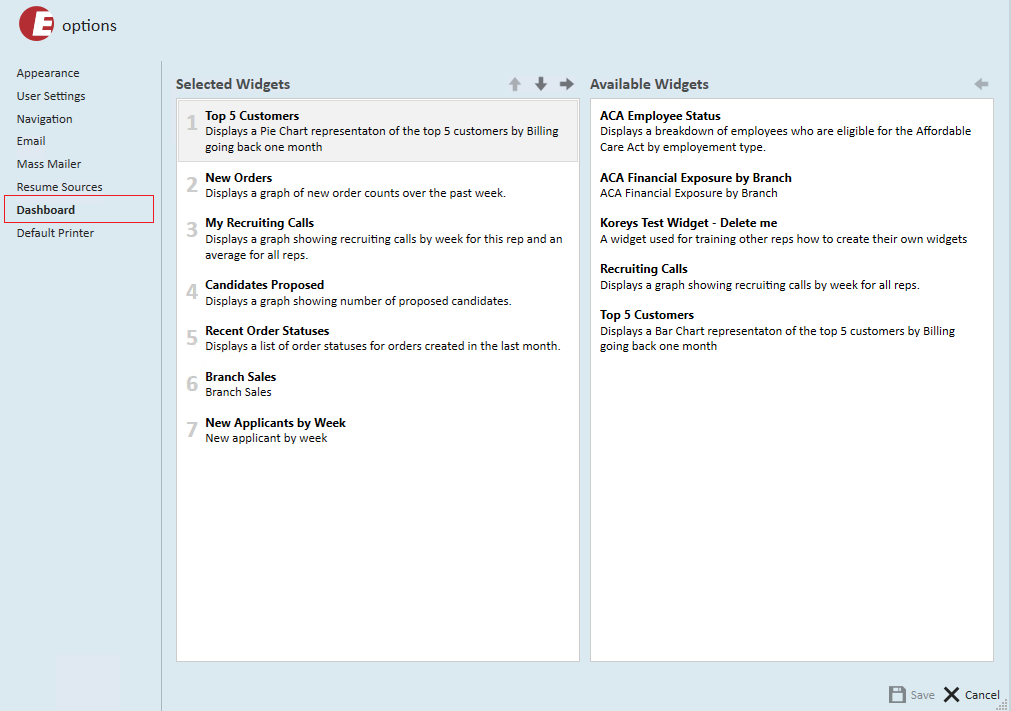
This will open the Dashboard section area where you can select your desired Widgets:
On the right will be a list of available Dashboard Widgets. On the left are the Widgets you have selected to appear on your Dashboard (remember, the Dashboard is your home screen!).
Managing Dashboard Widgets
Adding Widgets:
- To add a Widget to your "selected widgets" group, select/highlight the Widget then simply double click or click the left pointing arrow:

Removing Widgets:
- To remove a selected Widget, select/highlight the Widget then simply double click or click the right pointing arrow:

Organize your Dashboard Widget Display
Users may change the order in which the Widgets will be displayed on their Dashboard, by changing the number sequence in the "selected widgets group." Simply click to highlight a Widget then click the up/down arrows to move it: ![]()
The Widget at the top (i.e. the number "1" position) will default in the main display space on your Dashboard.
Default Dashboard Widgets
Widgets are interactive. Hover your mouse over the data within a Widget, when the mouse changes to a pointing finger, click to "drill into" the data.
When drilling into a Widget, Enterprise will either navigate to the corresponding record, generate the corresponding report or display the search results which drove that data.
New Orders
- The number of Orders created for the past 7 days
Recent Order Status
- The number of Orders created in the past month grouped by status
Recruiting Calls
- The number of Recruiting calls per rep per week for the past 4 weeks
*Note* A recruiting call is any message logged using "1st recruiting call" action code.
Top 5 Customers
- Top 5 Customers by Sales volume in the past month
Branch Sales
- Gross Sales by Branch in the past month
Candidates Proposed
- The number of Candidates added to a candidate worksheet by week for the past 5 weeks
New Applicants by Week
- The number of new applicants each week for the past 4 weeks
*Note* This is listing new applicants by service rep that have been added into the system via manual entry or resume parser; it is not looking at new HRCenter online applicants.