What are Insight Widgets?
Not to be confused with our Insight Integration, Beyond Insight Widgets provide snap shots of important information in your system. These options are located on your dashboard, the first thing every user sees when they log in.
This article reviews all the different default insight widgets available.

Insight Widgets can be added to any dashboard by selecting the edit option and tapping on the + icon to add new widgets. To learn more about Beyond Dashboard options, check out Beyond - Dashboard.
Types of Insight Widgets
Insight widgets come in a few different styles. This section reviews the types
Chart
Chart-based insight widgets are meant to be a visual representation of different data or information. Charts can be line graphs, bar graphs, pie charts, calendars, etc.


*Note* The following filtering options are available depending on the chart:
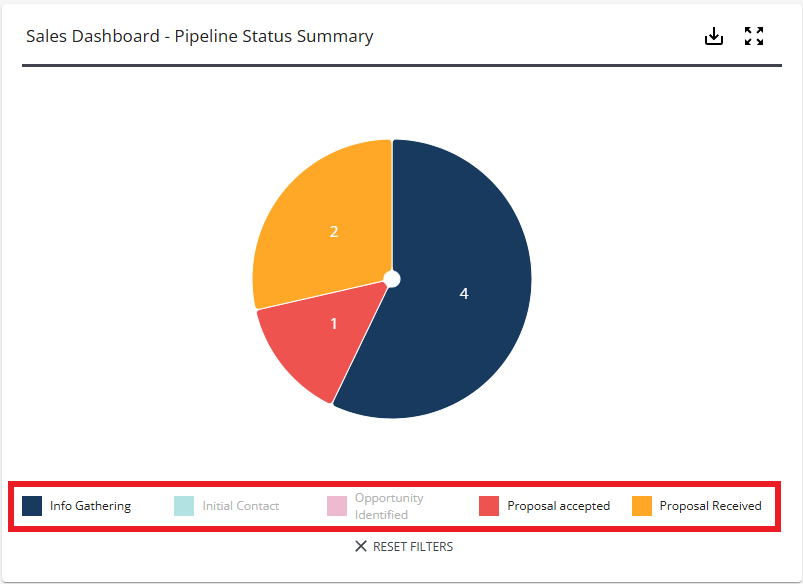
- Charts are able to be filtered by selecting items within the Legend:
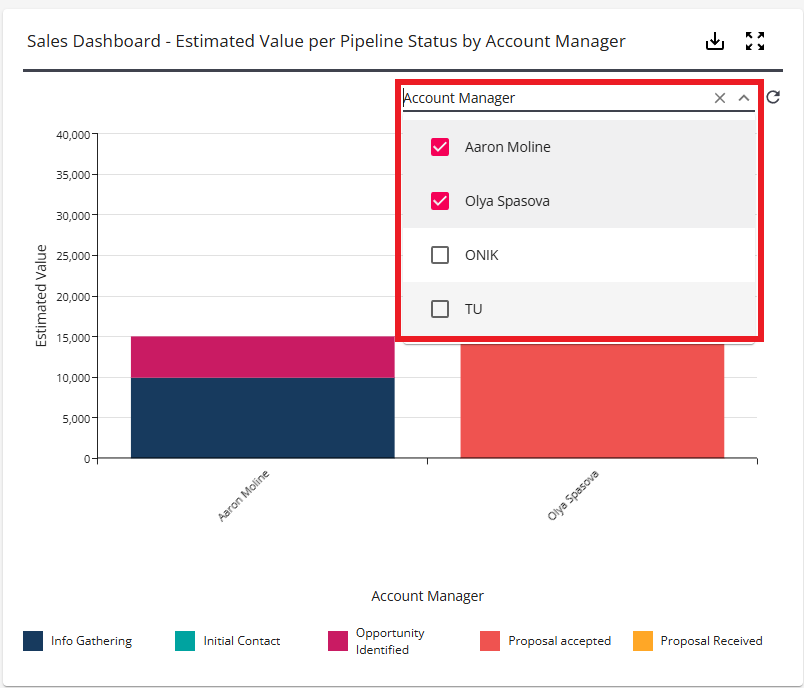
- Bar, line, and bump charts are also able to be filtered by the values within the x-axis via the dropdown:
*Note* Data within charts are able to be exported to PDF, Excel, or CSV via the  button at the top right of the widget:

- Exporting as a PDF will export the data as an image of the widget as it is presented.
- Exporting as an Excel or CSV file will export all of the data, regardless of filters selected within the widget.
Single Value
Single value insight widgets typically give you a specific number or value back. For example, the number of employees without an I-9 on file.

Multi-Value
Multi-value insight widgets provide a few key numbers, amounts, or other values that typically related to one another. For example, the candidate summary which gives you the total number of candidates added, assigned, and total overall.

Table
Table-based insight widgets allow you to see a table of information. For example, the top 5 customers near their credit limit shows the customers name, AR Balance, Credit Limit, etc. in a table format.

List of the Default Widgets Available
Below is a list of each default insight widget available. Use this list to review what each widget displays and where that information comes from in your system.
Table of Contents:
- Assignments - Assigned Employees with Missing or Expired I9s
- Assignment - Summary
- Back Office - Missing Timecards
- Back Office - Unclaimed Timecards
- Customers - Top 5 AR Over 30
- Customers - Top 5 By YTD Revenue
- Customers - Top 5 Near Credit Limit
- Employees - Available Employees
- Employees - Background Checks
- Employees - New Applicants by Branch
- Employees - Upcoming Employee Birthdays
- Financials - Employee Billing Summary - Last Week
- Financials - Gross Profit By Branch
- Financials - Gross Profit by Sales Team
- Financials - Invoice Aging Summary By Invoice Date
- Financials - Payroll Costs Breakdown
- Job Orders - Active Orders By Sales Team
- Job Orders - Buzz Job Offers
- Job Orders - Candidate Summary
- Job Orders - Fill Ratio
- Job Orders - New Orders
- Messages - Productivity
- Messages - Stream
- Missing Or Expired Documents - Top 5 By Last Name
- Prospects - Summary
- Prospects - Top 5 By Time Since Last Message
- Sales Dashboard - Estimated Value per Pipeline Status by Account Manager
- Sales Dashboard - Pipeline Status Summary
- Tasks
Assignments - Assigned Employees With Missing Or Expired I9s
Single-Value

Displays the current number of employees that have an active assignment and are missing or have an expired I9. This is a great way to audit your system. In a perfect world, this number should be at or close to zero, but in our demo database, it looks a little scary.
Where this information comes from:
- If the number displayed here is greater than 0 the line in the widget will turn red
- Employees must have an active assignment:
- Assignment start day must be today or before today
- End date must be after today
- To determine whether an employee has an I-9, this widget looks for the I-9 document type on the employee record > documents tab:

- Federal I-9s created in HRCenter will automatically be saved with the Federal I-9 document type
Recommended Advanced Search:
- Employee is Assigned
- Document Type does not equal I9 OR Document Type equals I9 and expiration date is not on or after today's date
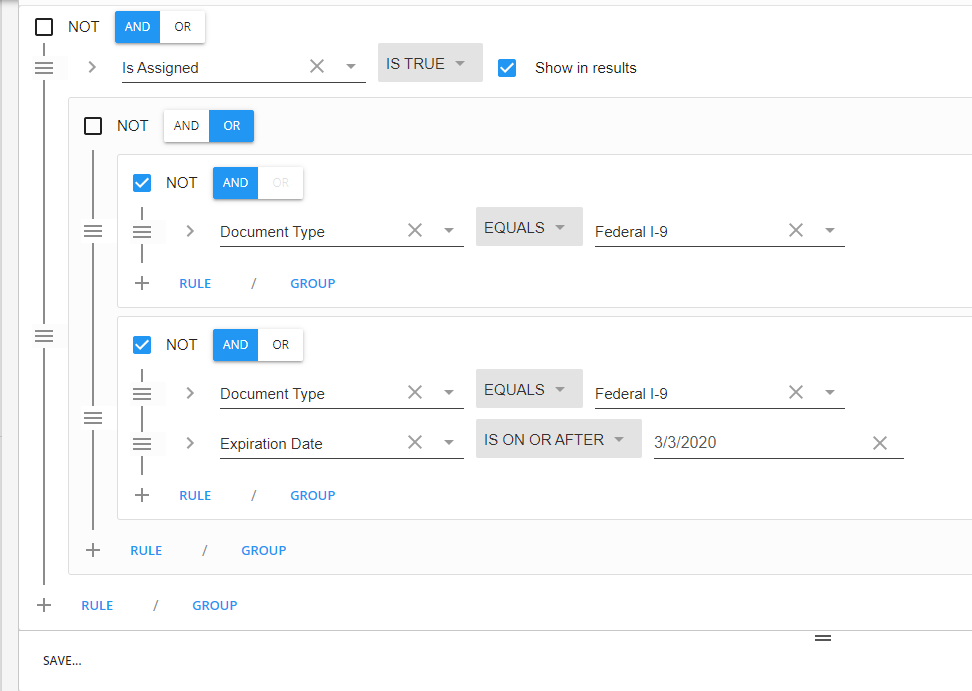
We recommend creating this search and then saving it so you don't have to re-create it each time you want to see a list. Check out Beyond - Advanced Searching for more information.
*Note* Keep in mind that the number on the insight widget and in the search includes employees who have an I-9 that does not have an expiration date entered.
Assignments - Summary
Multi-Value

Displays:
- Number of assignments started
- Number of assignments ended
- Total number of active assignments
- Average Pay Rate
- Average Bill Rate
- Average Markup
Selecting the Report button at the bottom of this card will bring you to the Assignment Register Report.
Where this information comes from:
You need to enter the number of days filter located at the top to determine how many days this data is looking at: 
Back Office - Missing Timecard
Single Value

Displays current number of timecards without time entered on them
Where this information comes from:
- "Missing Timecards" are considered transactions in time entry that do not have any hours entered on them
- This excludes WebCenter timecards
- Select "Report" to be brought to the Missing Timecards Report
Back Office - Unclaimed Timecards
Single Value

Shows the number of unclaimed timecards currently in the system. This includes WebCenter timecards and TimeClock timecards that have not been pulled into a proofing session yet.
Where this information comes from:
- Select the "Time Entry" button to be directed to Time Entry in Beyond as long as you have the correct security permission
Customers - Top 5 AR Over 30
Table

List of the top 5 customer records that have AR over 30 days old.
Where this information comes from:
- This list shows the 5 customer records with the most AR over 30 days old
- AR over 30 means that they have payments due over 30 days old, more details can be found on the AR Statement Summary Report
- The contact information listed on this widget are the primary contact options found on the contact card on the customer record:
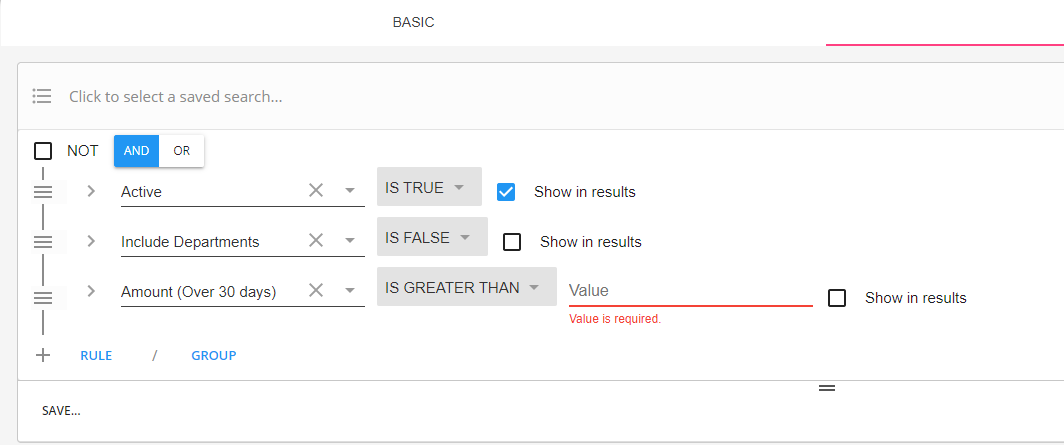
Recommended Advanced Search:
You can run a customer search to find a list of customers over or under a specific AR amount.
- Customer is Active
- Amount (Over 30 Days) is greater than or less than [Enter Dollar Amount]
Customers - Top 5 By YTD Revenue
Table

List of the top 5 customers/departments with the most year-to-date revenue.
Where this information comes from:
- This listed the top 5 customers/departments with the most year-to-date revenue
- The contact information listed on this widget are the primary contact options found on the contact card on the customer record:

Customers - Top 5 Near Credit Limit
Table

Displays a list of the top 5 customers that are closest to their credit limits
Where this information comes from:
- This widget requires that you are entering credit limits on your customer records in Enterprise
- AR Balances can be further reviewed in AR Statement Summary Report
- The contact information listed on this widget are the primary contact options found on the contact card on the customer record:

- Percentage of Limit is determined by Total AR Balance / Credit Limit
Employees - Available Employees
Multi-Value
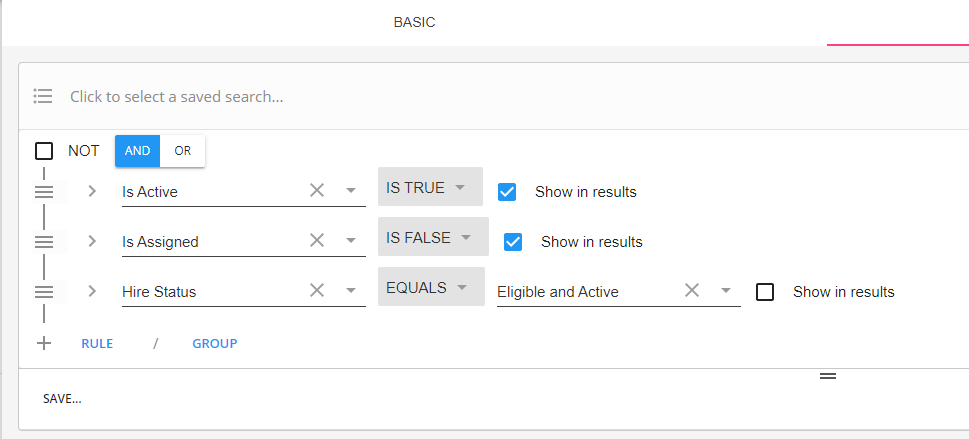
 Displays number of eligible and active, unassigned employees and number of employees whose assignments are ending within the next 7 days.
Where this information comes from:
- Eligible & Active, Unassigned Employees:
- employees who do not have a current active assignment AND
- has hire status = Eligible & Active
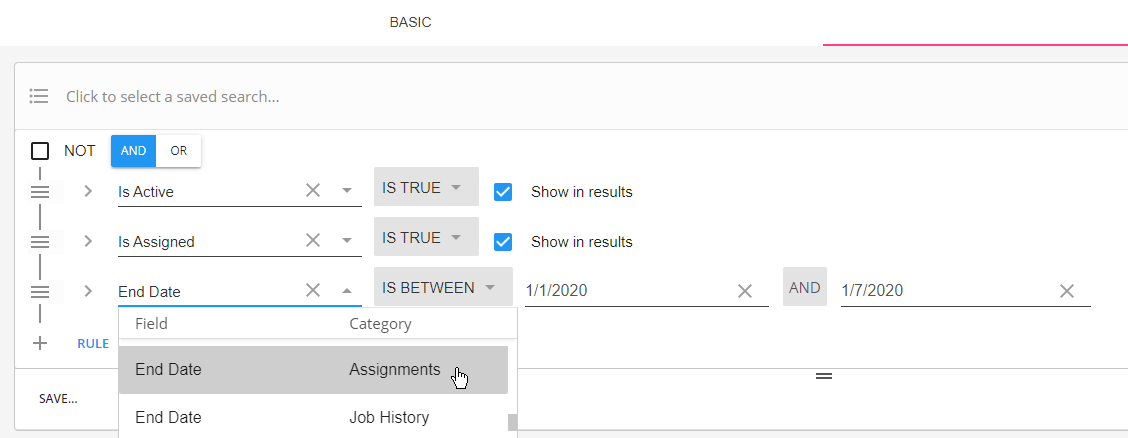
- Employees with Assignments ending in the next 7 days:
- For those of you who know an assignment is ending today or some day in the future, if you enter that actual date ended on an assignment if its within the next 7 days, it will show here.
Recommended Advanced Searches:
Eligible & Active, Unassigned Employees:
Employees with Assignment Ending Soon:
Employees - Background Checks
Multi-Value

Displays number of background checks by status and includes a quick link to the background check search.
Where this information comes from:
- This widget is only available in your system if you are utilizing and of our background check integrations in Beyond.
- Utilize the background check search to find all background check requests in your system.
Employees - New Applicants By Branch
Bar Graph/Chart

Displays number of applicants per branch in the last 30 days including a breakdown of applicants by their how-heard-of information.
This is a great way to track not only total applicants but also what marketing strategies are working to recruit these new applicants.
Where this information comes from:
- Applicants include all new employee records added into the system
- How heard of information can be asked for during the HRCenter applicant process or entered manually on the employee's detail tab > how heard of card:

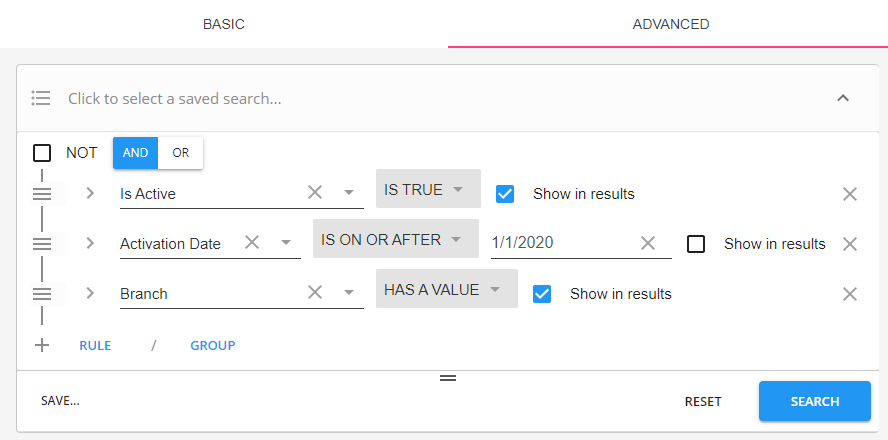
Recommended Advanced Search:
- Employees that are active
- With Activation date is on or after today's date
- Branch = show in results
Employees - Upcoming Employee Birthdays
Table

List of employees with birthdays within the next 7 days (including today)
Where this information comes from:
- Birthday information is found under the employee record on the equal employment opportunity card
- Birthdays on this widget will only display the month and day (not the year)
- The "View Report" button will bring you to the Employee Birthday List Report
Financials - Employee Billing Summary - Last Week
Multi-Value

Shows the total number of employees that had hours that were billed last week and the week prior to last.
Shows the total number of hours that were billed last week and the week prior to last.
Where this information comes from:
- When we refer to "Last Week," we are talking about the last closed week in your system
- When we refer to "Prior Week," we are talking about the week before the last closed week in your system
Financials - Gross Profit By Branch
Bar Graph/Chart
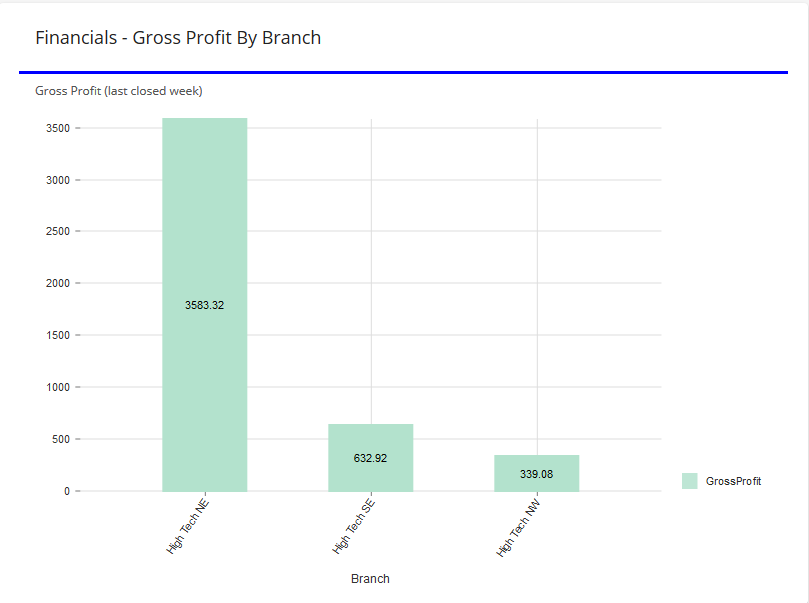
Displays chart of total gross profit amounts for each branch
Where this information comes from:
- Gross profit calculations are based on our standard Gross Profit Report and include all payroll costs
- Gross profit numbers are from the last closed week
- Keep in mind this will only show branches within your current hierarchy level
Financials - Gross Profit By Sales Team
Bar Graph/Chart
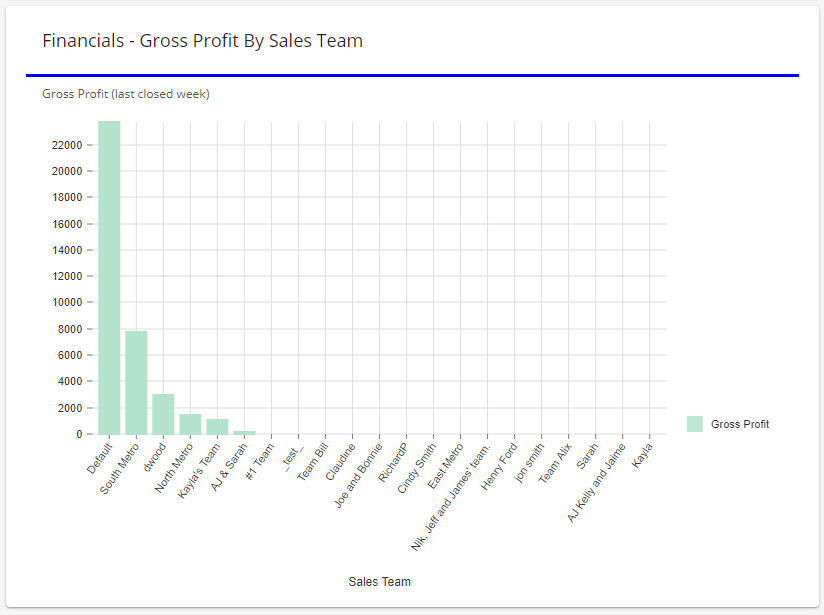
Displays chart of total gross profit amounts for each Sales Team
Where this information comes from:
- Gross profit calculations are based on our standard Gross Profit Report and include all payroll costs
- Gross profit numbers are from the last closed week
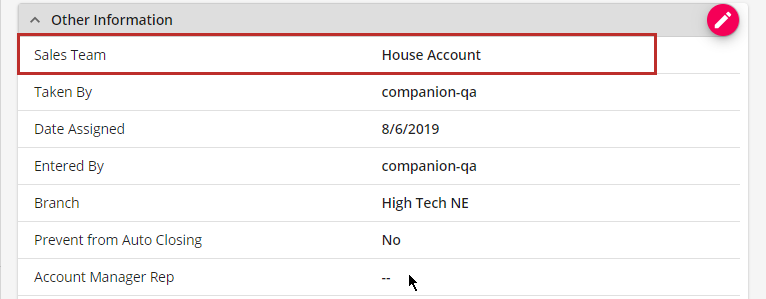
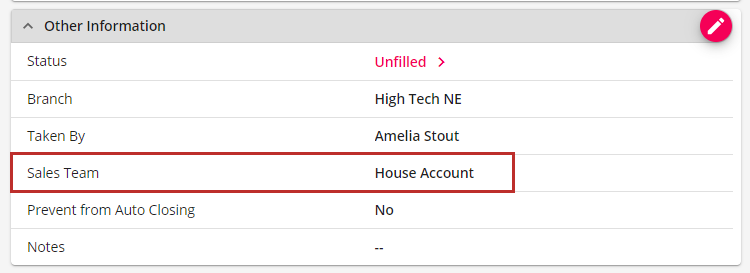
- Sales team is set on the order and assignment records on the Details tab > Other Information card:
Financials - Invoice Aging Summary By Invoice Date
Multi-Value
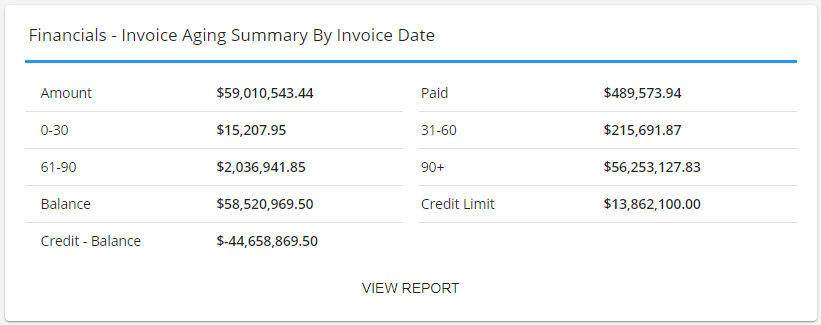
Displays Invoice Aging numbers including total amounts, amount paid, etc. based on the date invoiced.
Where this information comes from:
- This report shows by default as of today's date. You can change the end date at the top of your dashboard:

- "View Report" button will open our standard Invoice Aging Summary Report
Financials - Payroll Costs Breakdown
Pie Chart
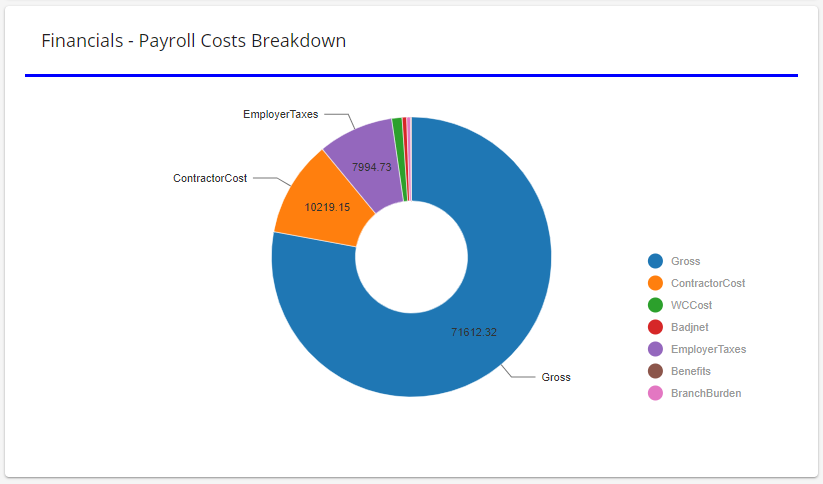 Breaks down the different kinds of payroll costs for the last closed week.
Where this information comes from:
- Information displayed on payroll costs is for the last closed week in your system
- Gross encompasses all W2 payroll related costs
- Contractor Costs comes from all 1099/Vendors paid
- Employer Taxes are what you as the employer has paid in taxes from the last closed week
- Worker Comp Costs are determined by the percentage setup in Enterprise administration and the worker comp code selected on the financials card of the assignment record
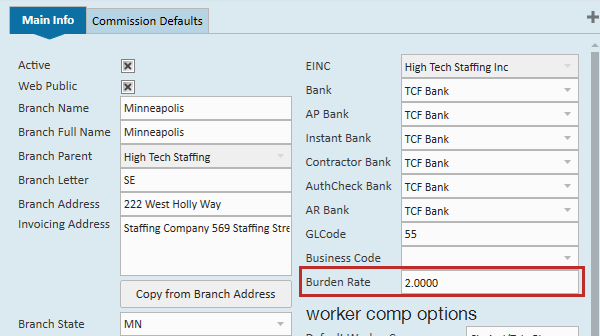
- Branch Burden is determined by the burden amount set on the branch setup in Enterprise Administration
Job Orders - Active Orders By Sales Team
Bar Chart/Graph
Displays current number of active orders for each sales team in a bar graph format
Where this information comes from:
- Active orders are orders with an active status (i.e. Not canceled, closed, deleted, etc.)
- Sales Teams are set up in Enterprise and selected on the order record under the other information card:
Job Orders - Buzz Job Offers
Pie Chart/Graph
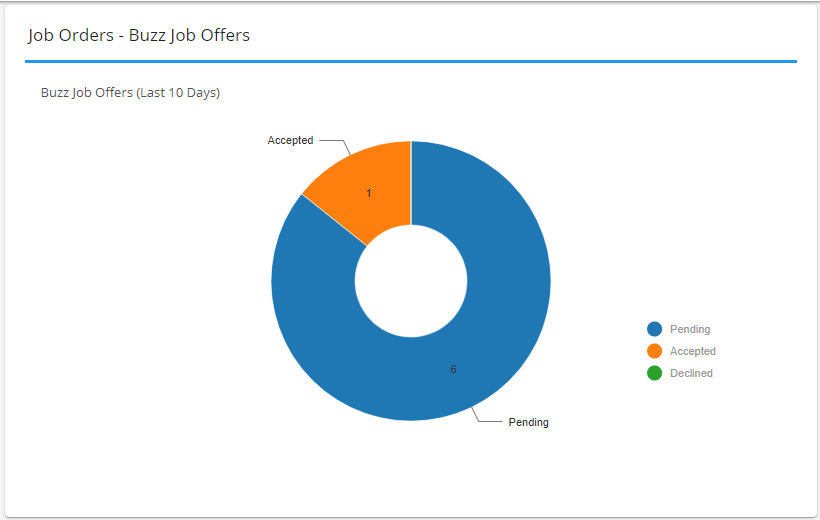
If you are utilizing our Buzz Job Offers functionality, you can track the number of offers that are pending, accepted, and declined using this chart.
Where this information comes from:
You need to enter the number of days in the past that this chart will include: 
The pie chart is separated into 3 sections:
- Sent: Number of offers sent but have not been accepted or declined yet
- Accepted: Number of offers accepted by the employee
- Declined: Number of offers employees declined
*Note* This chart only works for days in the past and will not update for the current day's offers
Job Offers - Candidate Summary
Multi-Value

Displays total number of candidates added and candidates assigned in the select number of days as well as the total number of current candidates.
Where this information comes from:
You need to enter the number of days in the past for candidates added and assigned:
- Candidates refer to the candidate worksheet on an order
Job Orders - Fill Ratio
Pie Chart

Visual representation of current orders with a breakdown of filled vs. unfilled
Where this information comes from:
You need to enter the number of days you want to look back for orders at the top of your dashboard:
- The "View Report" button will bring you to the standard Order Fill Ratio Report
Job Orders - New Orders
Multi-Value

Shows number of new orders created including a breakdown by whether they have been posted to the JobBoard yet.
Where this information comes from:
This widget requires a number of days to be entered under the filter options at the top (This is number of days in the past including today's orders):
- To learn more about posting to the JobBoard, check out Beyond - Posting Jobs to Your TempWorks Job Board
Messages - Productivity
Bar Graph/Chart

Shows number of messages logged for each service rep, breaking it down by message action code.
Where this information comes from:
- This widget requires a number of days to be entered under the filter options at the top (This is number of days in the past including today's orders):

- The colored options appearing on the side are message action codes that can be customized by your admin
- Numbers in each section show total number of messages logged for each message action code
- You can get more information by checking out our Message Productivity Report.
- Note that your hierarchy can change which service reps and messages you see
Messages - Stream
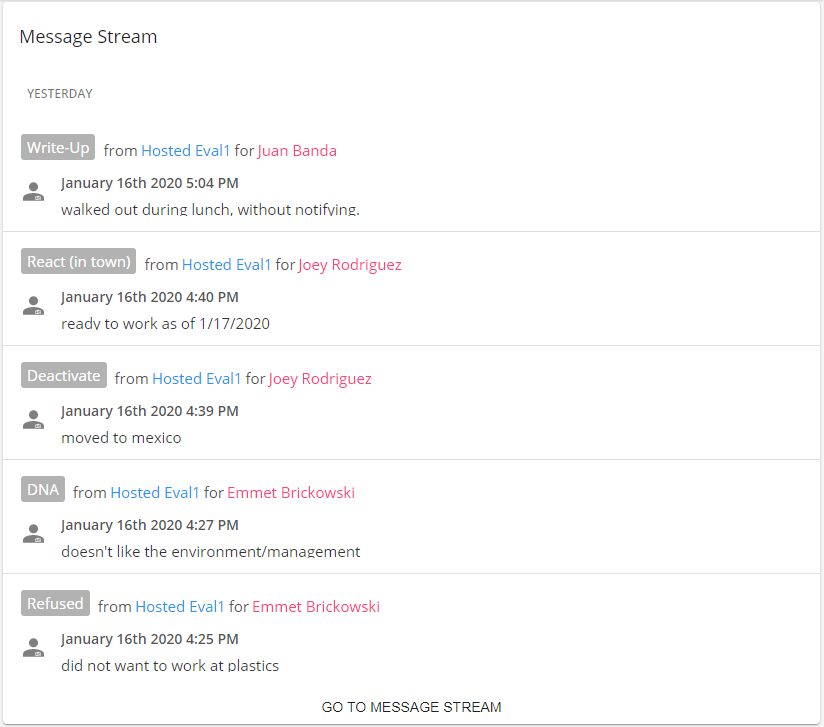 Shows last logged messages by all service reps in your hierarchy view.
This is a great option to help everyone at a branch stay on the same page!
Where this information comes from:
- Information includes Message Action Code, Service Rep who logged the message, what record it was logged on, and the message details
- See Beyond - Message Logging for more information on logging messages in Beyond
- Select the "Go to Message Stream" to see more messages logged in chronological order
Missing Or Expired Documents - Top 5 By Last Name

Shows the top 5 Missing or Expired Documents based on the Employees last name.
Where this information comes from:
- Information includes the name of the employee, the ID of the employee, and the Required Documents that are Missing and/or Expired for that employee.
- See Beyond - Employee Required Documents for more information on the setup and utilization of Required Documents on the employee record.
- Select the "View All" option within the Widget to be navigated to the Required Documents Search area within Beyond.

*Note* You will have to select the "Search" option for the list to populate.
Prospects - Summary
*Note* For new TempWorks clients as of 8/11/2023, Prospect functionality will be disabled. In the event you would like for this functionality to be enabled, please contact TempWorks Support.
Existing TempWorks clients prior to 8/11/2023 will continue to have access to this functionality. In the event you would like for this functionality to be disabled, and for your existing Prospect records to be converted to Customer records in mass, please contact TempWorks Support.
Multi-Value

Summary of new prospects, converted prospects, and total prospects.
If you're utilizing the prospect record type this widget can be extremely insightful for your sales team!
Where this information comes from:
You need to enter the number of days you want to look back for orders at the top of your dashboard:
- New prospects are prospect records created within the number of days selected
- Prospects converted to customers include the number of prospects that have been converted in the number of days selected
- Active prospects refer to prospects with an active status
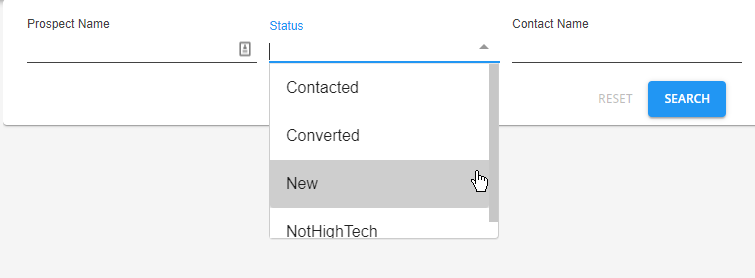
You can find prospects by selecting  in the upper left:
Prospects - Top 5 By Time Since Last Message
*Note* For new TempWorks clients as of 8/11/2023, Prospect functionality will be disabled. In the event you would like for this functionality to be enabled, please contact TempWorks Support.
Existing TempWorks clients prior to 8/11/2023 will continue to have access to this functionality. In the event you would like for this functionality to be disabled, and for your existing Prospect records to be converted to Customer records in mass, please contact TempWorks Support.
Table

Displays the 5 prospects who have not been contacted in the longest amount of time.
This is a great way for your sales team to manage their prospect records
Where this information comes from:
- Prospect records must be active to appear on this list
- Last message is the action code of the last message logged on the prospect record
- Last Message Date is the date of the last message logged on the prospect record
- The contact information listed on this widget are the primary contact options found on the contact card on the customer record:

Sales Dashboard - Estimated Value per Pipeline Status by Account Manager

Shows, at a glance, the estimated value of prospect customers per specific Sales Pipeline statuses.
Sales Dashboard - Pipeline Status Summary

Shows, at a glance, the amount of prospect customers within specific Sales Pipeline statuses.
Tasks
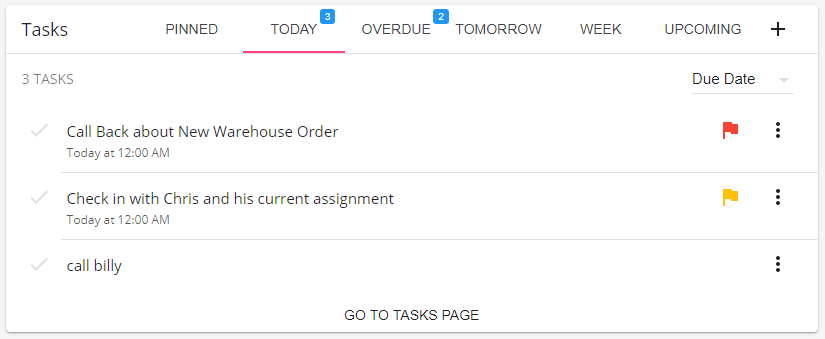
Displays quick view of current and future tasks created in Beyond.
Where this information comes from:
- Check out Beyond - Tasks for an in-depth view on all the options available in this widget and on the related Tasks Page


